운영서버의 메모리 사용률이 90%가 넘어가면서 메모리증설 이슈가 생겼습니다.
메모리 증설을 하기전에 서버 점검도 하고
메모리 누수는 없는지 Eclipse MAT Tool 로 점검해보았습니다.
Server Check
Eclipse Memory Analyzer 설치 전에 서버를 살펴볼까요?
서버 메모리 사용량을 봅시다.
$ free -h
              total        used        free      shared  buff/cache   available
Mem:            11G        6.6G        200M        617M        4.8G        4.0G
Swap:           15G        111M         15G
서버내 메모리 Top 10 를 살펴봅시다. (예시로 보여주기 위해 가공했습니다.)
jenkins 프로세스가 RSS 2.7 G, VSZ 9.5G 를 사용하고 있군요.
9.5G 메모리는 VAS에 할당된 메모리 주소의 합, 2.7 G 메모리는 물리 주소의 총 합이라고 보시면 되겠습니다.
- VSZ : Virtual Memory Size, 가상메모리의 크기
- RSS : Resident Set Size, 현재 점유하고 있는 메모리의 크기
$ ps -eo user,pid,ppid,rss,vsize,pmem,pcpu,time,cmd --sort -rss | head -n 10
USER       PID  PPID   RSS    VSZ %MEM %CPU     TIME CMD
user   25611     1 2755168 9533080 22.7 0.2 10:23:29 java -Xms2048m -Xmx2048m -jar /home/jenkins/jenkins.war --httpPort=190
user    6942     1 1964000 10725108 16.1 12.0 16-15:23:11 java -Xms1024m -Xmx2048m -jar /home/batch-0.0.1-SNAPSHOT.jar --server.port=110
root       1     0 1744860 1784816 14.3 0.0 07:13:11 /usr/lib/systemd/systemd --switched-root --system --deserialize 21
root     430     1 56472 111696  0.4  0.0 01:53:18 /usr/lib/systemd/systemd-journald
root   14640     1 31680 742000  0.2  0.0 00:26:03 /usr/sbin/rsyslogd -n
user   13946     1 24912 904156  0.2  0.0 00:45:28 node app.js
| option | desc | desc |
|---|---|---|
| rss | RSS | resident set size, the non-swapped physical memory that a task has used (in kiloBytes). (alias rssize, rsz). 상주 세트 크기, 태스크가 사용한 스왑되지 않은 물리적 메모리(킬로바이트 단위) |
| size | SIZE | approximate amount of swap space that would be required if the process were to dirty all writable pages and then be swapped out. This number is very rough! 프로세스가 쓰기 가능한 모든 페이지를 더티한 다음 교체하는 경우 필요한 교체 공간의 대략적인 양입니다. 이 숫자는 매우 거칠다! |
| vsize | VSZ | see vsz. (alias vsz). |
| vsz | VSZ | virtual memory size of the process in KiB (1024-byte units). Device mappings are currently excluded; this is subject to change. (alias vsize). |
| pmem | %MEM | see %mem. (alias %mem). |
| %mem | %MEM | ratio of the process’s resident set size to the physical memory on the machine, expressed as a percentage. (alias pmem). |
| %cpu | %CPU | cpu utilization of the process in “##.#” format. Currently, it is the CPU time used divided by the time the process has been unning (cputime/realtime ratio), expressed as a percentage. It will not add up to 100% unless you are lucky. (alias pcpu). |
PID 25611 프로세스 jenkins.war 가상 메모리 사용량을 확인해볼까요?
9533080K 로 VSZ 9.5G 위에서 본 크기와 동일하군요.
VSZ는 실제 프로세스에 할당된 메모리의 번지수의 합과도 같습니다.
Pmap 은 프로세스의 메모리 할당 현황을 보여주는 명령입니다.
$ pmap 25611
25611:   java -Xms2048m -Xmx2048m -jar /home/jenkins/jenkins.war --httpPort=190
0000000080000000 2109696K rw---   [ anon ]
0000000100c40000 1036032K -----   [ anon ]
...
00007ffcda788000      8K r-x--   [ anon ]
ffffffffff600000      4K r-x--   [ anon ]
 total          9533080K
JVM Xms Xmx
Xms : 초기 java heap size
Xmx : 최대 java heap size
Xms 설정된값과 Xmx 가 다른경우 메모리 공간을 확장할때 jvm에서 살짝 딜레이가 발생한다고 합니다.
그래서 kafka 경우는 xms 값과 xms 값을 동일하게 설정합니다.
Garbage Collector, Heap, and Runtime Compiler Default Selections These are important garbage collector, heap size, and runtime compiler default selections:
- Garbage-First (G1) collector
- The maximum number of GC threads is limited by heap size and available CPU resources
- Initial heap size of 1/64 of physical memory
- Maximum heap size of 1/4 of physical memory
- Tiered compiler, using both C1 and C2
출처 : Ergonomics
번역
물리적 메모리의 1/64인 초기 힙 크기
물리적 메모리의 1/4에 해당하는 최대 힙 크기
!! Xms Xmx 옵션값을 적용하지 않았을 경우
64G 메모리 서버인 경우
Xms 1G, Xmx 16G 설정이 적용된다고 보면 됩니다.
하지만 항상 저렇게 적용되지는 않는다고 합니다.
서버에서 확인해 보았습니다. 가이드대로 나오는군요.
$ ~/jdk11/bin/java -XX:+PrintFlagsFinal -version | grep -i 'heapsize'
   size_t ErgoHeapSizeLimit                        = 0                                         {product} {default}
   size_t HeapSizePerGCThread                      = 43620760                                  {product} {default}
   size_t InitialHeapSize                          = 1056964608                                {product} {ergonomic}
   size_t LargePageHeapSizeThreshold               = 134217728                                 {product} {default}
   size_t MaxHeapSize                              = 16848519168                               {product} {ergonomic}
    uintx NonNMethodCodeHeapSize                   = 5836300                                {pd product} {ergonomic}
    uintx NonProfiledCodeHeapSize                  = 122910970                              {pd product} {ergonomic}
    uintx ProfiledCodeHeapSize                     = 122910970                              {pd product} {ergonomic}
   size_t ShenandoahSoftMaxHeapSize                = 0                                      {manageable} {default}
openjdk version "11.0.19" 2023-04-18
OpenJDK Runtime Environment Temurin-11.0.19+7 (build 11.0.19+7)
OpenJDK 64-Bit Server VM Temurin-11.0.19+7 (build 11.0.19+7, mixed mode)
자주 찾아보는 옵션입니다.
참고로 permsize 사이즈는 자바8에서 deprecated 되었습니다.
java -XX:+PrintFlagsFinal -version | grep -iE 'heapsize|threadstacksize|MetaspaceSize'
Local PC Spec.
로컬 PC 사양입니다.
- Apple M1 Pro
- macOS Ventura 13.4
Download
이클립스 툴의 플러그인으로 나온 MAT은 java heap dump 파일을 분석해줍니다.
플러그인으로 분석시 큰용량의 dump 파일 분석이 어렵다는 말이 있어 MAT 클라이언트 버전을 설치하였습니다.
https://www.eclipse.org/downloads/download.php
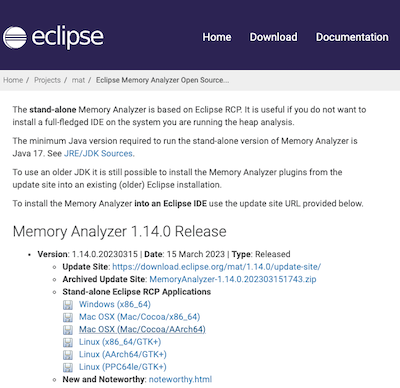
Stand-alone Eclipse RCP Applications > Mac OSX (Mac/Cocoa/AArch64)
Heap Dump
java 프로세스 목록을 확인합니다.
$ jps
25611 jenkins.war
69421 batch-0.0.1-SNAPSHOT.jar
heap dump 명령 형식은 아래와 같습니다.
jmap -dump:format=b,file=<filename.hprof> <pid>
명령을 실행합니다.
$ jmap -dump:format=b,file=heap_20230622.hprof 6942
Dumping heap to ~/heap_20230622.hprof ...
Dumping heap to ~/heap_20230622.hprof ...
Heap dump file created [786622722 bytes in 5.818 secs]
751M dump file 이 추출되었습니다.
서버에 있는 dump 파일을 로컬 PC 로 가져옵니다.
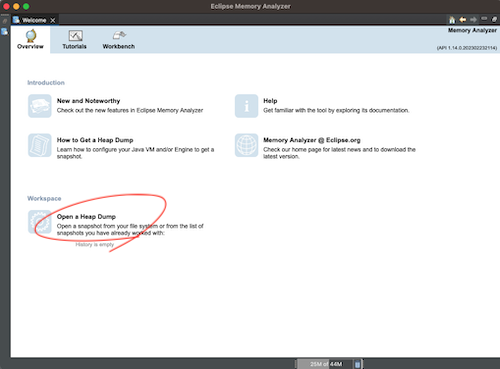
MAT 실행
Eclipse Memory Analyzer 를 실행한 첫화면입니다.
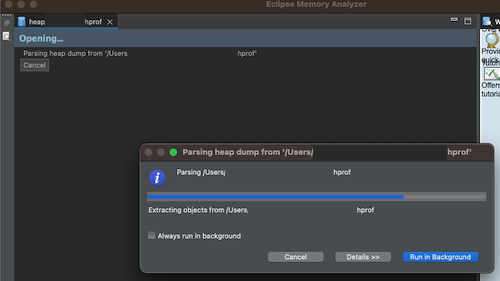
Open & Heap Dump 를 클릭해서 파일을 선택합니다.
참고로, 파일 확장자를 hprof 로 해줘야 파일 선택이 활성화 됩니다.
다른 확장자로 덤프파일을 생성 했더니 파일 선택창에서 프리징 되는 버그가 있었습니다.
기존에 사용한적이 있으면 History is empty 문구 대신 파일 목록이 나옵니다.
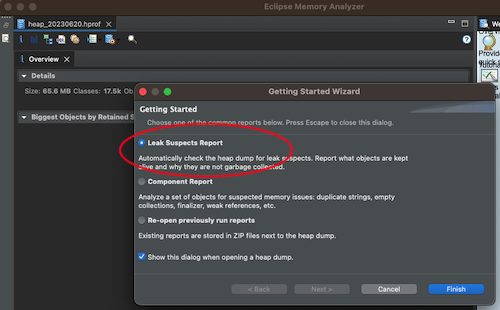
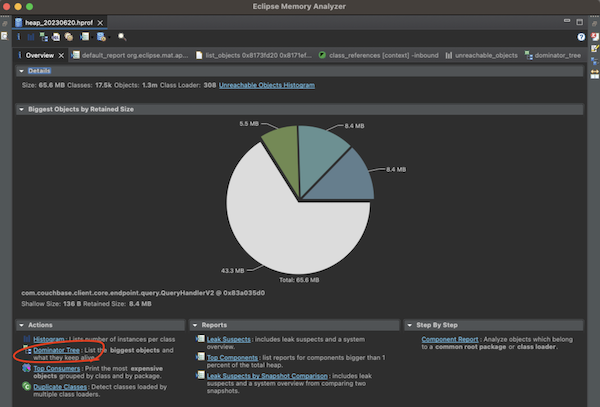
리포팅 화면입니다.
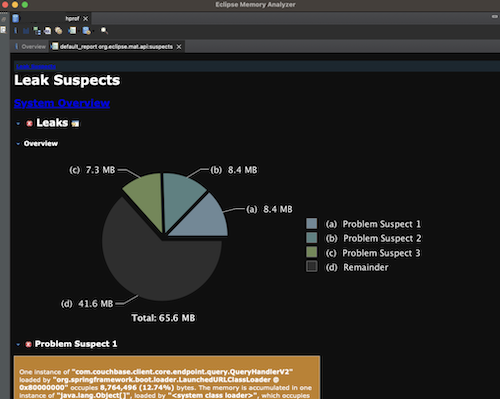
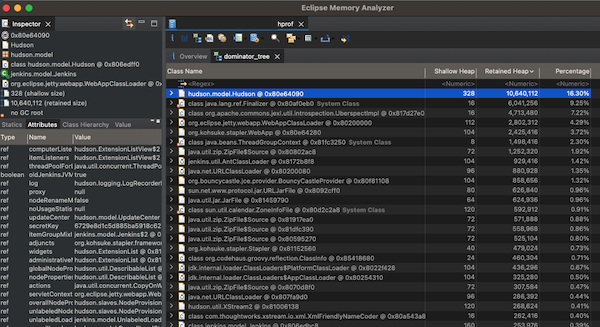
Overview 화면에서 Dominator Tree 가 있습니다.
큰 객체부터 정렬해서 보여주입니다.
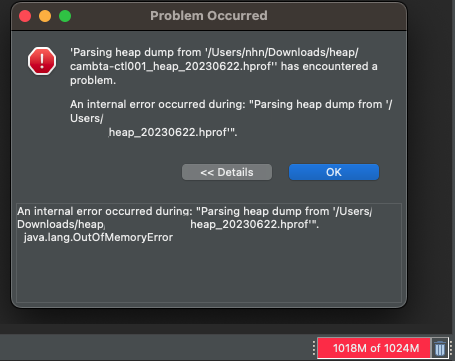
OutOfMemoryError
서버내 2개 java 서비스가 있는데
751M dump file 은 분석 성공, 1.6G dump file 분석은 실패하였습니다.
java.lang.OutOfMemoryError
서버내 서비스 OOM을 점검하는데 점검툴의 OOM 이라니.. ㅎㅎ
설정파일에 메모리 수치를 늘려줍니다.
수정 전 : -Xmx1024m
수정 후 : -Xmx2g
$ vi /Applications/mat.app/Contents/Eclipse/MemoryAnalyzer.ini

-startup
../Eclipse/plugins/org.eclipse.equinox.launcher_1.6.400.v20210924-0641.jar
--launcher.library
../Eclipse/plugins/org.eclipse.equinox.launcher.cocoa.macosx.aarch64_1.2.700.v20221108-1024
-vmargs
--add-exports=java.base/jdk.internal.org.objectweb.asm=ALL-UNNAMED
-Xmx1024m  // -Xmx2048m
-Dorg.eclipse.swt.internal.carbon.smallFonts
-XstartOnFirstThread
Eclipse Memory Analyzer 재실행하여 1.6G dump 파일 분석 성공~!
HeapDumpOnOutOfMemoryError
JVM 실행 옵션에 위 옵션을 추가하면 OutOfMemoryError가 발생했을 때 힙메모리 덤프를 생성합니다.
원인을 모르는데 종종 메모리 사용률이 많은경우 옵션을 적용해두면 유용할꺼 같습니다.
(ex. 파라메터 누락으로 인해 특정 케이스에만 무한 루프 로직을 타는 경우)
-XX:+HeapDumpOnOutOfMemoryError